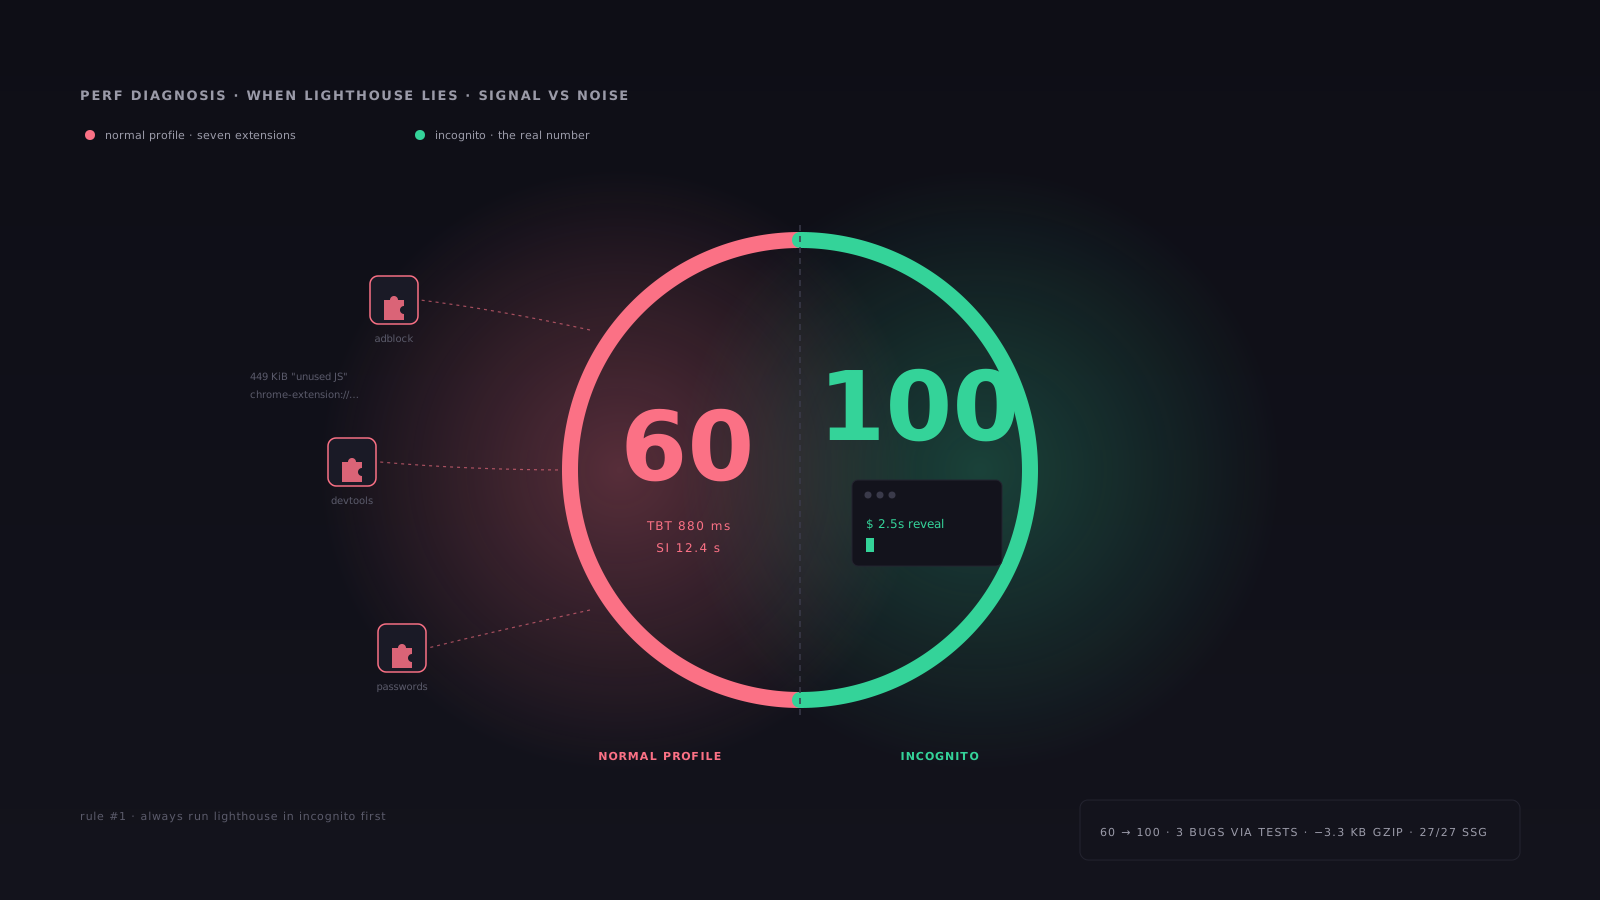
The audit started with a number nobody wants to see on their own portfolio: a Lighthouse performance score of 60. Total Blocking Time 880 ms in red. Speed Index 12.4 s — also red. A single audit row called "Element render delay: 20,340 ms" pointed at a paragraph in the hero terminal.
By the end I'd written ~700 lines of code, deployed twice, found three production bugs Lighthouse never mentioned, and concluded that the original 60 score was almost entirely lying.
This is a writeup of how the diagnosis actually went, in the order it happened, including the dead ends. The point isn't "I made it faster"; the score was already 100 in an Incognito window before I touched the code. The point is the discipline of separating signal from noise when the headline metric is misleading.
What the report actually said
I'd run Lighthouse from a normal Chrome profile against the live site. The summary panel showed:
- Performance: 60. Red.
- TBT: 880 ms. Red.
- Speed Index: 12.4 s. Red.
- LCP: 1.1 s. Green (?!).
- Cumulative Layout Shift: 0. Green.
LCP green + Speed Index red is the giveaway. It means content largely paints fast, then visual progress keeps drifting in over the next ten seconds. That's not a load problem; that's an animation problem. Which is something every Lighthouse audit I've ever seen on a portfolio overlooks, because the score panel is what people show in screenshots, not the metric breakdown.
I pulled up the audit details. Three findings looked promising:
- Legacy JavaScript: 14 KiB estimated savings. A polyfill chunk
with
Array.prototype.at,Object.fromEntries,String.prototype.trimEnd. These have been baseline for years; modern browsers don't need them. - Reduce unused JavaScript: 449 KiB.
- Minify JavaScript: 71 KiB.
I read finding (2) more carefully. Every single URL in the breakdown
was chrome-extension://... — uBlock Origin's content scripts, React
DevTools, two password managers, an automation extension. Same for
finding (3). Lighthouse was measuring my browser's installed software
running in the same tab, not my site.
Lesson 1: Lighthouse runs in the user's Chrome profile by default. If the test session has extensions enabled, their content scripts count against your perf score.
I re-ran in an Incognito window. The 449 KiB and 71 KiB savings disappeared completely. Perf jumped to 100. TBT dropped from 880 ms to near zero. Speed Index, however, was still elevated.
What was actually wrong
So extensions accounted for finding (2) and (3) entirely. That left the polyfills, Speed Index, and the bizarre 20-second "Element render delay" on a terminal paragraph.
The polyfills (finding 1) traced to Next.js's own runtime. I greped
for the polyfilled methods and found them inlined in a chunk identified
by its Turbopack runtime preamble. next/dist/build/polyfills/polyfill-module.js
is 1.4 KB raw / 614 bytes gzipped. Each polyfill is ||-guarded, so it
adds zero runtime cost on modern browsers. Lighthouse's "14 KiB est
savings" was attributing the surrounding chunk's bytes to the polyfills
heuristically. Not actionable without patching Next.
Speed Index 12.4 s came from the hero terminal animation. My hero is a CSS-animated terminal that reveals lines over staggered delays. The longest delay was 4.9 seconds — meaning content kept fading in for nearly five full seconds after first paint. Lighthouse interprets that as "page still loading visually" and the SI clock keeps running. The 20-second "element render delay" on a specific paragraph was the same animation, just measured from a different angle.
The animation was a feature. I'd designed it that way. But for SI to read sanely, the total duration needed to come down. I halved every step in the timing table — total reveal time dropped from 4.9 s to ~2.5 s — without changing the staggered feel.
The refactor that didn't help much
Before measuring SI properly I'd already done what most engineers reach for first: hunt down client components that don't need to be client components.
I went through the 28 files with "use client" and found four
candidates where the only reason for client-side rendering was either
usePathname() (for active-state styling), or navigator.userAgent
detection (for ⌘ vs Ctrl in a keyboard hint), or a wall-clock
update (the Berlin time in the footer). All three are state-from-outside-react
problems that have a much cheaper solution than a hydration boundary:
a small inline <script> tag.
The pattern I landed on:
- A server component renders the markup with
data-*attributes indicating what each element represents (data-nav-target="/work",data-lang-link="de",data-berlin-clock). - An inline
<script>at the end of<body>runs synchronously during HTML parse, after all the targets exist in the DOM. It stamps initial state — sets the active class, rewrites the locale-toggle hrefs to preserve the current path, fills in the clock. - A tiny client component (~30 lines of imperative DOM updates) listens
for SPA navigation via
usePathname()and re-runs the same logic.
This took two "use client" files out of the layout chunk, two out of
the footer, and gave the site a consistent pattern. It also accidentally
fixed a pre-existing hydration mismatch I hadn't been aware of: the
old NavLink component called usePathname() which returns null at
SSR and the actual path at hydration, producing a silent React warning
on every page render.
The actual bundle savings: 3.3 KB gzipped on the home page, less than 1 KB on every other page. The architecture is cleaner; the bytes saved are marginal. Worth saying out loud.
The bugs the tests caught (not the audit)
I wrote Playwright tests for the new behaviors so they wouldn't regress. The tests failed for three different reasons.
Bug 1: inline script ran before its target element existed. I'd
placed BerlinClockScript near the top of <body> (alongside the
theme script). But the clock element renders inside the footer, far
later in the DOM. The script ran, found no [data-berlin-clock]
elements, did nothing. The clock stayed at --:-- for up to a full
minute until the script's internal setInterval next fired and
re-queried. Fix: move the script to the end of <body> so target
elements exist when it executes.
Bug 2: React hydration overwrote the script's mutation. Even after
the script correctly filled in the clock, the text snapped back to
--:-- a few hundred milliseconds later. Why: the clock span sits
inside <ThemeProvider>, a client component that owns hydration of
the entire footer subtree. React's reconciliation found the DOM text
(15:42) differed from the server-rendered text (--:--) and patched
the DOM back to match. Fix: add suppressHydrationWarning to the span
so React leaves it alone.
Bug 3: NextLink ignored my href rewrite on the locale toggle. My
inline script rewrites the locale toggle's href from /de to
/de/writing (so clicking DE while on the EN writing page preserves
the path). But NextLink reads the href from its React prop, not from
the DOM attribute. When clicked it called router.push("/de") — the
prop value — and the path was lost. Fix: use a plain <a> instead of
NextLink, accepting a full page reload on locale switch. Acceptable
trade-off because users switch locale infrequently.
All three bugs were in code I'd already shipped to production by the time the tests caught them. None of them surfaced in the Lighthouse report.
Lesson 2: performance audits tell you about the curve of visible metrics. They tell you nothing about whether the inline script you just wrote actually does what you think it does. That's what tests are for.
What I'd tell someone starting this audit
Three rules that would have saved me an hour each:
- Always run Lighthouse in Incognito first. If the perf score moves significantly from your normal profile to Incognito, the gap is your extensions, not your site. Diagnose the real number.
- LCP green + Speed Index red means you have an animation problem, not a load problem. No amount of bundle splitting will fix it. Look at what's still visually changing after LCP fires.
- Cleaner architecture rarely shows up in Lighthouse numbers when the site was already fast. The 3.3 KB gzipped savings here is real but invisible on a desktop perf score that was already 100. Architecture work is worth doing for maintainability and for slow devices that Lighthouse can't simulate accurately — not for the headline score.
Where the work actually paid off
Not in the score. The Incognito perf score was already 100 before I started; it's still 100 after. What changed:
- Hydration mismatches that had been silently shipping since Phase 2
are gone. Every
NavLinkandLangToggleinstance was producing a hydration warning that no one noticed. - A 6.3 KB raw / 2.5 KB gzipped animation chunk no longer ships to the ~80% of visitors who never click "reveal the magic". It loads on interaction now.
- The hero text now ships as static HTML. Search engines and visitors on slow connections see the content immediately, before any JavaScript runs.
- Three production bugs surfaced and got fixed. Not because they showed up in metrics — because the tests I wrote for the new behaviors flushed them out.
The trip cost: about half a day of focused work and one production deploy. The reward: a site I can reason about more honestly, and a test suite that will catch the next category of regression. Both of those compound over time. The score, frankly, was always going to be 100; it just had to escape from a browser profile with seven extensions installed.